

The question is how can we measure Income Inequality? Fortunately it can be measured with a statistical approach known as the Gini Coefficient.The Gini Coefficient was developed by a statistician named Corrado Gini, and it is a measure of the income distribution of the population in a country. It range between 0 and 1 with 0 being in perfect equal and 1 being highly unequal. It helped define the gap between the rich and poor nations. The income distribution of a nation can also be represented graphically with the Lorenz curve below.
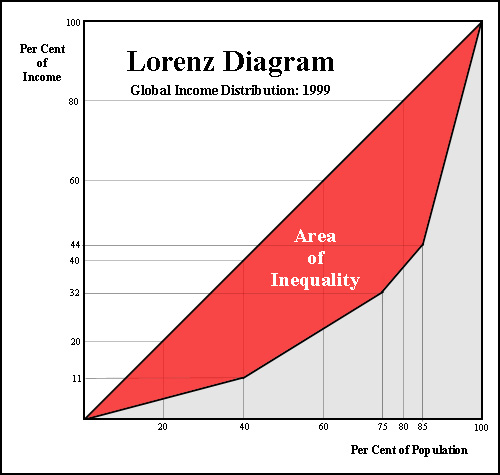
The upward sloping 45 degrees sloping line represents the equal distribution of wealth. An example will be the intersection point of the 20% of the income distributed and the 20% of the population. On the y-axis (vertical) you have the income distribution as expressed in decimals and on the x-axis you have the wealth of the nation. The area that is shaded in red represents the ‘area of inequality’ in income distribution. So the flatter the Lorenz curve the bigger will be the 'area of inequality' and hence income distribution.
An example of unequal distribution is where the 11% of income intersects with the 40% of the population on the Lorenz curve. This shows that 11% of the income is distributed to 40% of the population.
How Malaysia compared to the rest?
Anyway as of 2009 Malaysia is ranked 102 out of 136 countries surveyed by the CIA for the most unequal income distribution. The following is the income distribution of different ethnic in Malaysia and also its Gini coefficient from 1995 till 2009.
| Column1 | Column2 | Column3 |
| GINI Coefficient Of Malaysia | ||
| Etnicity |
2004
|
2009
|
| Bumiputra |
0.452
|
0.44
|
| Chinese |
0.446
|
0.425
|
| Indian |
0.425
|
0.424
|
| Others |
0.462
|
0.495
|
| MALAYSIA |
0.462
|
0.441
|
Source : Economic Planning Unit 2009
The performance of Malaysia’s Gini Coefficient from 1995 – 2009

Source : Department of Statistics Malaysia
According to World Bank, Malaysia was one of the few East Asian countries that reverse its income inequalities over the past decades but unfortunately reverses its direction since the 1990s. In other words policies drafted by policy makers since then are not effective.
This may be due to the bias policies that are drafted to the benefit of the ‘Bumiputra’ community while neglecting others and also the emergence of a new ‘ruling class’ that are make up of political cronies. This new group are given special treatments and are encouraged by the ‘powers to be’ to gobble up much of the nations strategic and big businesses in order to make up what they called the ’30 percent Bumiputra quota’.
Needless to say the end result is the re-emergence of the old Colonial type of ‘Rent Seeking’, businesses where being the monopoly or duopoly is the order of the day. As we know being in a position to monopolize any sector of the economy will only resulted in being contented. No incentive for being innovative and competitive made this conglomerates being redundant and badly managed and in the end left to decay.
Good examples include MAS, PERWAJA STEEL, PROTON and Bank Bumiputra just to name a few.
